Humans are dumb.
We spend our whole lives comparing ourselves against a magical finish line. Who doesn’t wish they weighed 10 pounds less, were 10 years younger, and made $10,000 more per year.
All of that time spent comparing ourselves against an ideal version of ourselves is bad, but you know what can be even more destructive?
Comparing yourself against someone else.
In this post, I’m going to allow you to compare yourself to your fellow federal employees by walking through the average TSP balance by age or years of service.
There are tons of great reasons you should know the average TSP balance by age. However, don’t worry if your numbers don’t match up. Your TSP balance at any age is just one measure of your preparedness for retirement, and it is certainly not a reflection of your self-worth.
So let’s dive in and take a look!
Get Gov Worker’s top 4 tips for federal employees!Table of Contents
- Brief Summary of the TSP
- 50% of Americans over age 55 have *no* retirement savings
- TSP Statistics from the FRTIB
- The TSP Millionaire’s Report and the average TSP balance by Age
- The TSP Millionaires Report breaks down account balance by years of TSP participation, not age
Please do not confuse my personal blog for financial advice, tax advice or an official position of the U.S. Government. This post may contain affiliate links. If you make a purchase after clicking on a link, I get a small percentage of the sale at no additional cost to you.
Brief Summary of the TSP
The TSP is a defined contribution retirement account available to federal employees and uniformed services members. The TSP is similar to a 401(k) in that both have the same maximum contribution limits.
However, federal employees can borrow from their TSP and withdraw money earlier than age 59.5 in some cases. Both CSRS and FERS employees can contribute to the TSP. The government will match the first 5% of FERS employees contributions to the TSP and those contributions are vested after 3 years. CSRS employees can contribute their own money to the TSP but it is not matched. The TSP has 5 investment options that follow major indices:
- The C Fund follows the S&P 500 index
- The S Fund follows small and midcap stocks
- The I Fund can be used to add international exposure to your portfolio
- The F Fund tracks the Bloomberg U.S. Aggregate Bond Index
- The G Fund invests in special government securities only available in the TSP and is guaranteed to never lose value.
Employees can also invest in one of many Lifecycle Funds that automatically adjust the portfolio each year to manage your risk as you approach retirement when it transitions to the TSP L Income Fund.
50% of Americans over age 55 have *no* retirement savings
Before diving into the TSP Millionaire’s report and the average TSP balance by age or years of service, it’s important to put these numbers in context.

According to the US Census Bureau, just under 50% of Americans age 55-65 have no money saved for retirement. Only 25% of Americans aged 55-65 have more than $100,000 saved.
Therefore, if you have just $1.00 in your TSP, you’re doing better than half of Americans at retirement age. Since the government gives FERS employees an automatic 1% contribution (even if you contribute nothing), you are doing much better than the average American when it comes to retirement savings.
Selection bias and when looking at the average TSP balance by age
Are you surprised that the median American has $0 saved for retirement? You’re not alone.
Typically, when people report the average 401(k) or TSP balance by age, they present the data from the Vanguard “How America Saves Report” which I have included below.
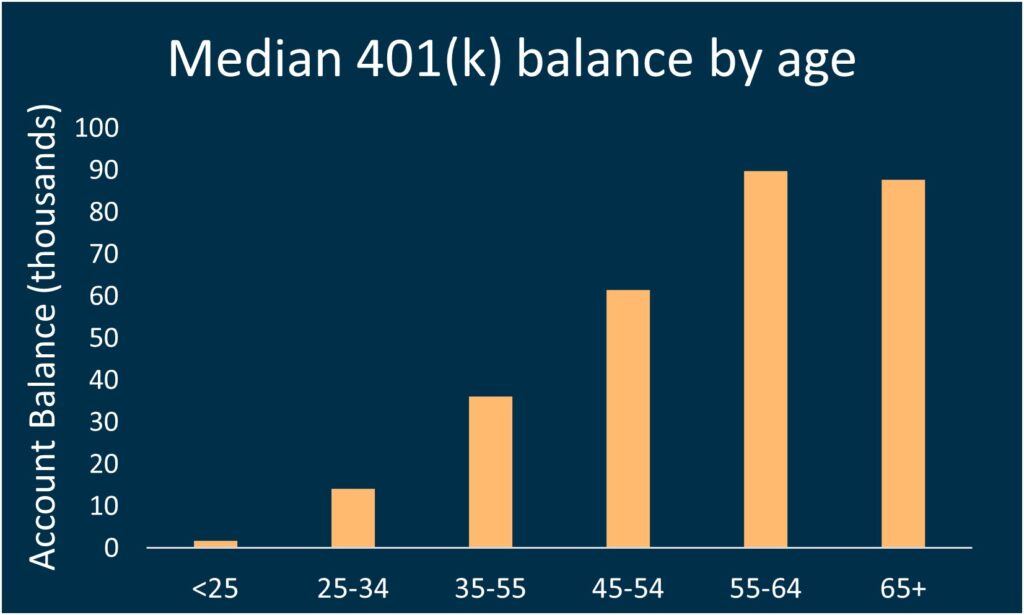
However, this data has a big selection bias. This is the average account balance by age of people with a 401(k). Since nearly half of Americans have no retirement savings, this significantly overestimates the amount people at each age have saved for retirement.
So when you look at average TSP balance by age or average 401(k) balance by age, know that just by having a 401(k) or TSP you are way ahead of the game.
TSP Statistics from the FRTIB
Now that we’ve set this important context around selection bias and TSP balances, we can jump into some statistics from the FRTIB.
The Participant Behavior and Demographics (FERS) report published by the FRTIB has a wealth of information in it (but does not include any information about the TSP balance by age). However, here are some of the most interesting statistics about TSP behavior across different age groups.
TSP participation rates by age
The TSP has an excellent participation rate! Nearly 95% of FERS employees make regular TSP Contributions.
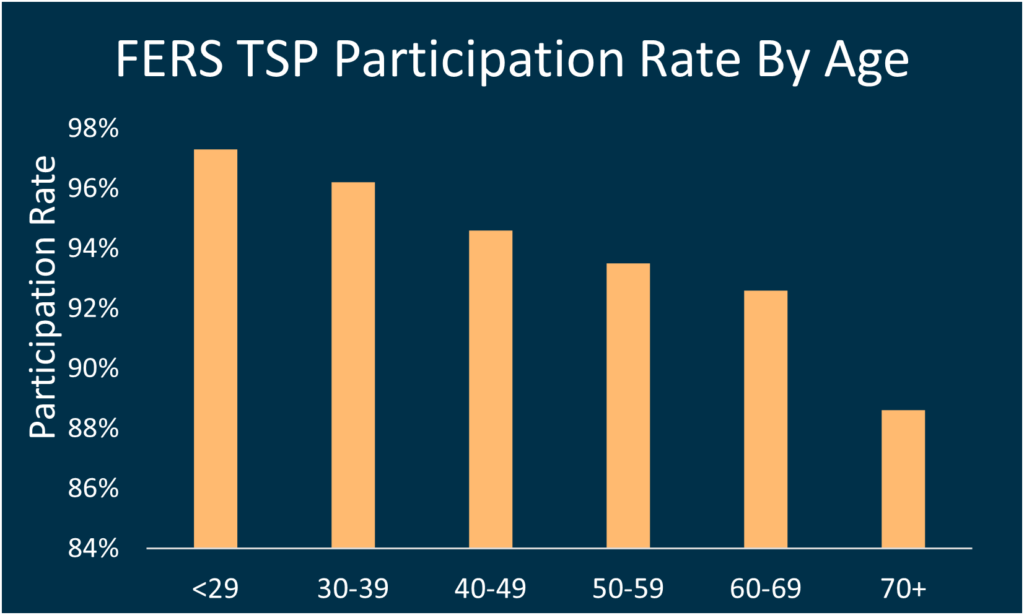
Younger employees are more likely to contribute to the TSP than older employees. The FRTIB believes that more young employees contribute because new employees are automatically enrolled at a 5% contribution and must opt out of TSP contributions instead of opting in.
However, even 89% of the oldest FERS employees (age 70+) are still contributing to the TSP.
TSP contribution rates by age
Not only are FERS employees participating in the TSP, the average TSP contribution for FERS employees is 8.1% of their salary. The FRTIB notes that this is higher than the private sector employee average contribution rate of 7.1% (Deloitte, 2019). (However, this 8.1% excludes people that have opted out of the TSP entirely which somewhat inflates the reported 8.1% “average”)
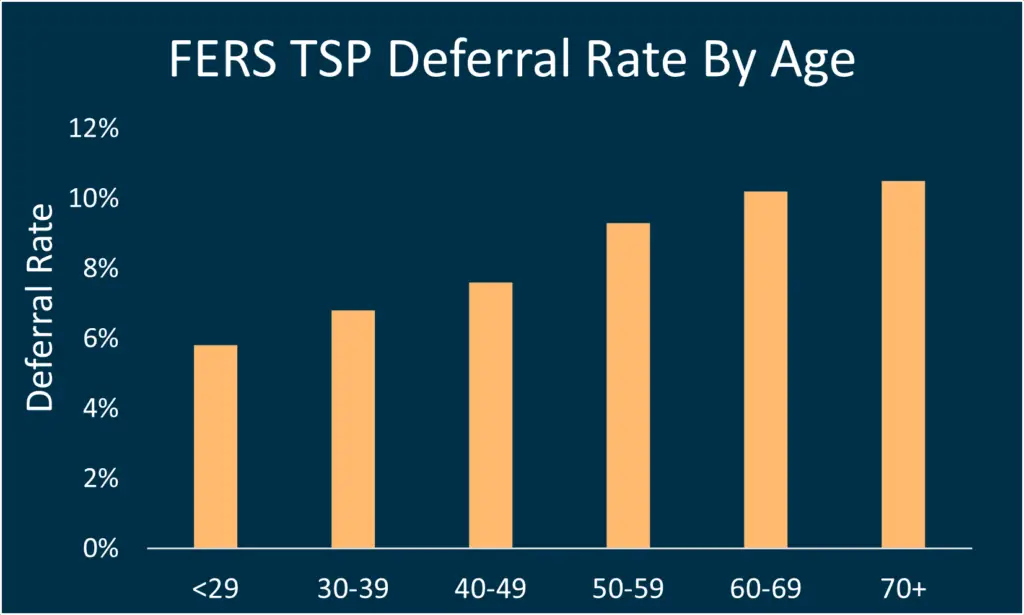
When you add in the 5% government TSP matching contributions, the average FERS employees is saving 13% of their salary for retirement.
According to “the shockingly simple math of retirement“, a 13% savings rate would allow you to retire after ~45 years of work. However, when you add in a FERS pension, and social security, the average FERS employee should be set for a solid retirement after a traditional 30 year career in government.
Not surprisingly, older employees are contributing more to their TSPs than younger employees. These employees are likely earning more money than their younger counterparts. Furthermore, while every family situation is unique, the older you are, the less likely you are to have kids that need financial support.
The average TSP balance by age is not on the FTRIB’s website
I have been looking for information about average TSP balances by age or years of contribution for a long time. Eventually, I wrote an email to the FTRIB’s press office, and they shared a special report with me, called the “TSP Millionaire’s Report” which they share with the press quarterly.
The TSP Millionaire’s Report and the average TSP balance by Age
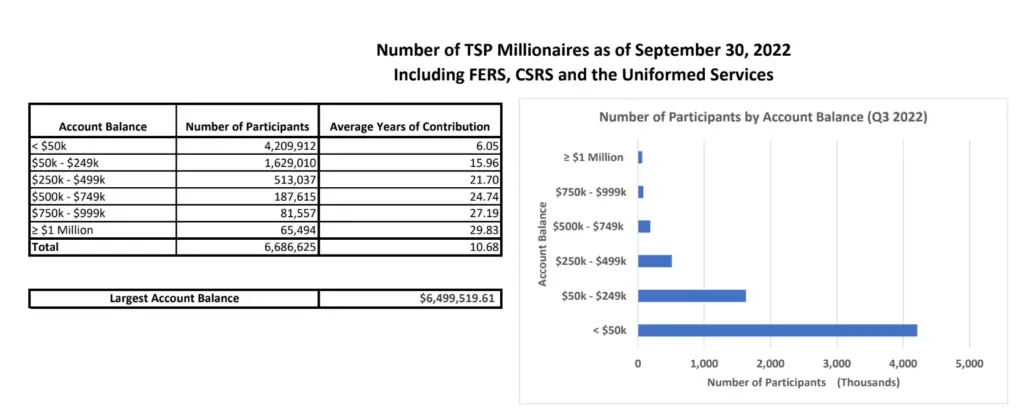
The TSP Millionaire’s Report contains information about the account balances of FERS, CSRS, and Uniformed Services participants along with their years of service. Participants with civilian and Uniformed Services accounts grouped together to reflect total TSP investment per individual.
The report groups TSP balances into 5 groups and shares the number of participants in each group along with the average years that they participated in the TSP:
- <$50,000
- $50,000 to $249,000
- $250,000 to $499,000
- $500,000 to $749,000
- $750,000 to $1,000,000
- >$1,000,000
As a data scientist, this grouping of TSP balances drives me completely bonkers. The number of participants with a given TSP balance is logarithmically distributed. Splitting them up along a linear scale like this makes it really hard to gain insights into the saving habits of TSP participants.
Regardless, here is a the latest TSP millionaire’s report as reported by the FRTIB.
The TSP Millionaires Report breaks down account balance by years of TSP participation, not age
As much as I wish TSP participants could get a summary of the average TSP balance by age similar to the Vanguard report, this data doesn’t exist in a published report..
However, we can glean some information from the TSP Millionaire’s Report.
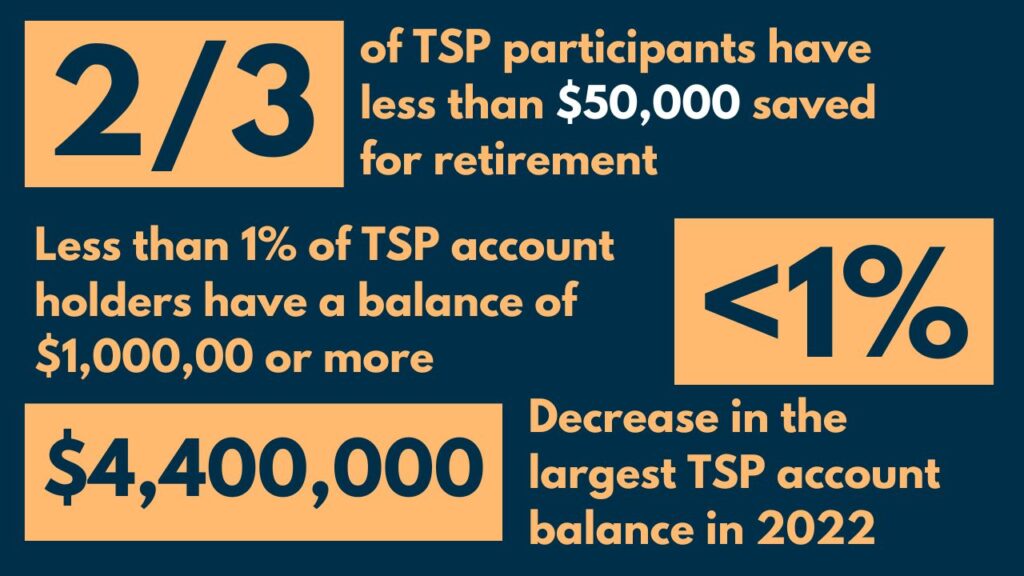
Nearly 2/3rds of participants have less than $50,000
If you’re worried about how your account balance compares against the average TSP balance by age and you have more than $50,000 in your TSP, then you’re probably above average for your demographic! Sixty-four percent (nearly 2/3rds) of participants have less than $50,000 in their account.
However, this may be a result of Uniformed Services participants who had only a few years of military service but kept their money in the TSP upon discharge.
The 500k club is made up of AARP eligible employees
If you look at the millionaire’s report, you’ll see that average years of participation for those with TSP balances above $500k is more than 25 years. While we don’t know what ages they started their TSP contributions (which could be as young as 18 for a Uniformed Services member), I’m guessing that the $500,000+ club is also (for the most part) the 50+ club.
Furthermore, those with balances above $250,000 have been contributing on average for over 20 years. Many of these employees are also likely to be within years of their MRA.
What we can learn about the average TSP balance by age from the TSP millionaires report
While the TSP millionaire’s report makes it difficult to compare your retirement savings to your peers in your 20’s, 30’s and 40’s, it does show the range of TSP balances around retirement age quite nicely.
Since the $500k, $750k, and $1M groups all had similar years of contributions it’s interesting to note that there were about 3 times as many people with balances between $500k and $750k as there were with balances above $1M.
While both of these groups of employees contributed throughout their careers, the $1M group contributed more and may have had a more aggressive TSP allocation as well. Using the 4% rule or a similar withdrawal strategy, the $1M group doubled their income in retirement.

