You’d need to be living under a rock not to hear someone talk about inflation this week.
Recently, the government announced that inflation was 6.2% from the past October. This is the highest inflation in 30 years.
People are freaking out.
On the macroscopic level, inflation eroded all of the wage gains people made since the start of the pandemic.
And inflation can be especially worrisome for retirees (and early retirees) who are living on fixed income.
If you’re an adherent of the Trinity Study and plan to live off of (inflation adjusted) 4% withdrawals, you’d know that high inflation can cause your portfolio to become completely depleted before you die.
As a result, I’ve seen some Tweet threads from people in the FIRE movement telling people to throw out the 4% rule, and instead try to live of a withdrawal rate of 1%, or maybe 2%. (Side note: if you have never heard about the 4% rule, check out Early Retirement Now’s safe withdrawal rate series for a very detailed analysis of why a 1% withdrawal rate is insanely conservative).
Regardless of the silliness on Twitter, I wanted to investigate this further. Because if I hadn’t read the news, I wouldn’t have realized that things are more expensive than they were a year ago.
- We’re still feeding our family of 5 for $500 per month.
- We’re still living on less than $10,000 per person per year.
- Our favorite car is still a bicycle, so I don’t even know how much gas costs.
- Our monthly spending in September and October was roughly what it’s been since we started tracking our spending in 2018.
So, just as I looked at how the pandemic affected our spending, I thought I’d take a look at whether inflation is something we need to worry about. (I meant “we” in the previous sentence as my family, but also “we” as in people with similar spending habits).
Table of contents
- Complete transparency on our spending
- How I conducted the inflation analysis
- A first look at inflation
- Inflation analysis
- The results- does inflation matter if you’re frugal (t-tests)?
- The results- does inflation matter if you’re frugal (graphical analysis)?
- What does this mean? Should you FREAK OUT about inflation?
Please do not confuse my personal blog for financial advice, tax advice or an official position of the U.S. Government. This post may contain affiliate links. If you make a purchase after clicking on a link, I get a small percentage of the sale at no additional cost to you.
Get Gov Worker’s top 4 tips for federal employees!Complete transparency on our spending
Lest anyone start to throw stones, I want to be completely transparent with the analysis. Since we “joined the FIRE movement” in 2018, we tracked our spending across 22 categories:
| Bikes | Bike supplies & maintenance |
| Charity | |
| Clothing | Clothing for kids (sometimes categorized in kids) |
| Date & Babysitting | |
| Daycare | |
| Entertainment | |
| Gas & Auto | Gas & car repairs |
| Gifts | |
| Groceries | |
| Haircut | Amount spent on haircuts |
| Health Insurance/Healthcare | We have a High Deductible Plan, includes premiums and expenses |
| Home Improvement | |
| Household | (A catch-all for things that don’t fit in other categories) |
| Insurance | Car & Home insurance. (Used to be part of mortgage before we paid off the house) |
| Kids | Items we purchased for the kids. |
| Pets | |
| Piano | Piano lessons for the kids (and for me until 2020) |
| Property Taxes | (Used to be part of mortgage before we paid off the house) |
| Restaurants | Money we spent on restaurants (excluding dates) |
| Utilities | |
| Vacation | |
| Work | Professional registration & other expenses |
In addition to these expenses, my wife and I both get an “allowance” that we’re free to spend on whatever we choose. We can’t see how the other person spends that money and we don’t track it. (I highly recommend this for people with joint finances.)
How I conducted the inflation analysis
You might think that the best way to see if inflation was a problem or not would be to compare my total monthly spending over the past few years. However, you’d be wrong.
We’ve had a lot of changes since 2018. We paid off the house. And we no longer have kids in daycare. Furthermore, some items, like charity, are free will offerings rather than a bill.
So for the inflation analysis, I removed the following categories:
- Charity (it’s a voluntary contribution, not a bill we get)
- Daycare (we had structural changes to this category)
- Gifts (like charity, gifts are voluntary)
- Insurance/Property Taxes (we used to lump these in with our mortgage payment, so can’t track them easily)
- Piano (We keep changing who is taking piano lessons in this house and have had to switch piano teachers multiple times. I’m pretty sure piano lessons aren’t causing these headlines about inflation.)
A first look at inflation
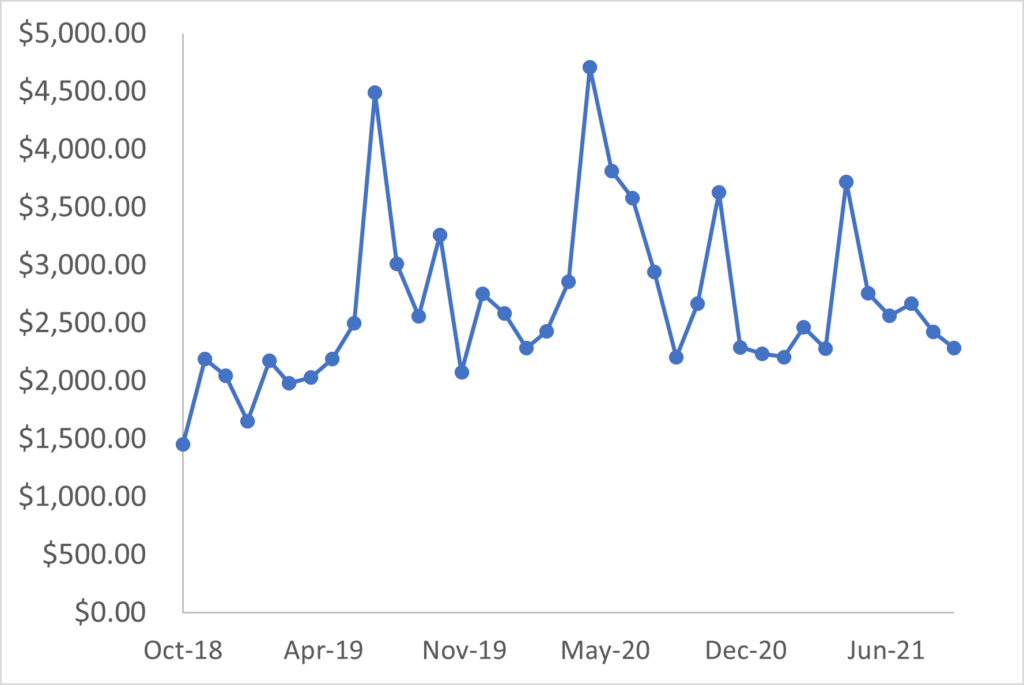
For someone that has all of this data, I sure haven’t looked at it in very much detail. The first thing I noticed when I plotted this out was that our spending was pretty spiky.

In thinking about it more, a lot of these spikes were caused when we had major medical expenses. With a high deductible plan, there are many months that our healthcare costs are low and then others it’s really high. (Like that time I crashed my bicycle and needed to go to urgent care to get X-rays and stuff).
Removing other categories that fluctuate
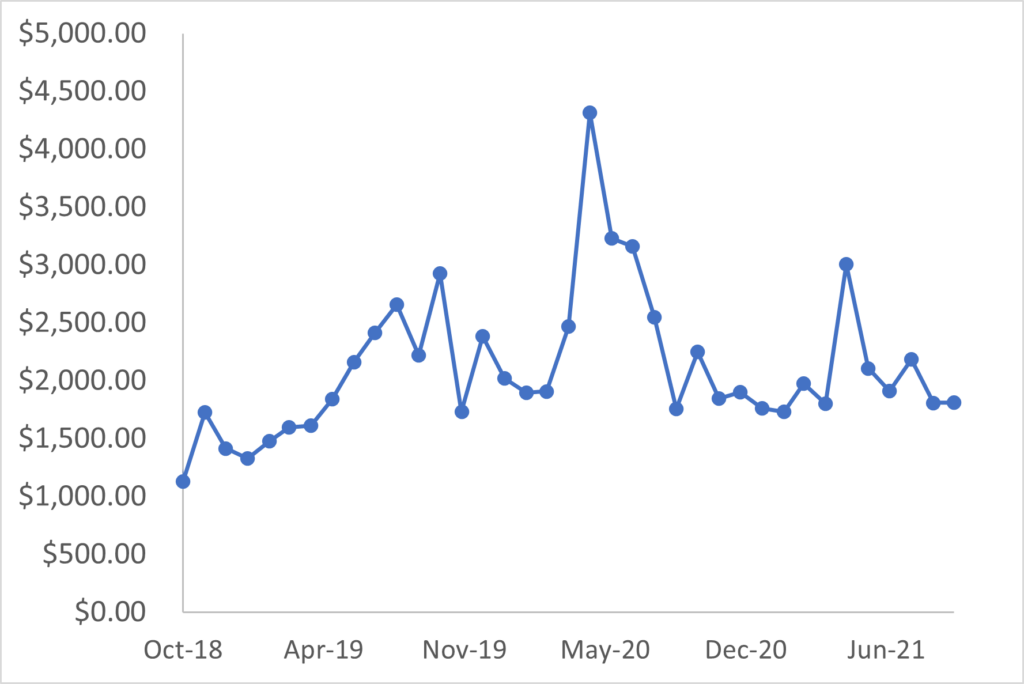
Here’s what the graph looks like without healthcare spending.

There are still some big spikes in May of 2020 & May of 2021.
In May of 2020, we adopted our adorable greyhound Kenny. Kenny is “greyt” but our greyhound cost us $2,000 over his first year living with us. I also DIY remodeled our basement bathroom and basement lighting during Spring 2020.
In May 2021, we booked a vacation rental that made our vacation spending spike that month.
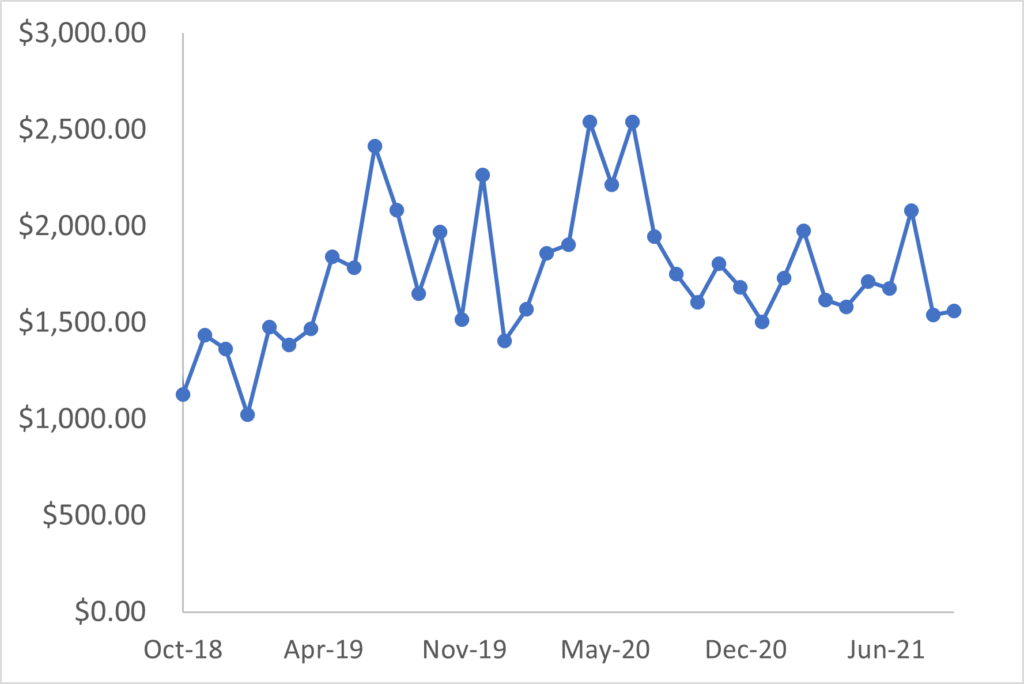
Just for fun, I made another graph of what our spending looks like without vacation & home improvement since these are also optional purchases that we chose to splurge on to make our lives better.

What’s the best way to look at inflation
I am a researcher.
I spend my whole life trying to find the signal in the noise.
After 20 years of doing research, I’ve learned that sometimes when you try to find the signal in the noise, you end up analyzing noise and claiming it’s a signal.
I don’t want to do that on my blog.
Honestly, I feel like the 3rd graph is probably the most representative way to look at how inflation has impacted my spending. However, for full transparency, I’m going to analyze all 3 graphs.
Using my patented “data gut check” from 20 years of data analysis, it looks like I’m spending more on a monthly basis than I was in 2018.
Of course, we added another sentient being to the family during that time so of course we’re going to be spending more.
But why use the eyeball test when we have data.
Inflation analysis
Since the headlines are all about inflation during the past year, I’m keeping my analysis to just the past 12 months.
I’m also going to analyze my spending 3 different ways:
- “All” expenses
- Without healthcare
- Without healthcare, home improvement, and vacation spending
Looking at inflation:
I’m going to look at inflation 2 different ways:
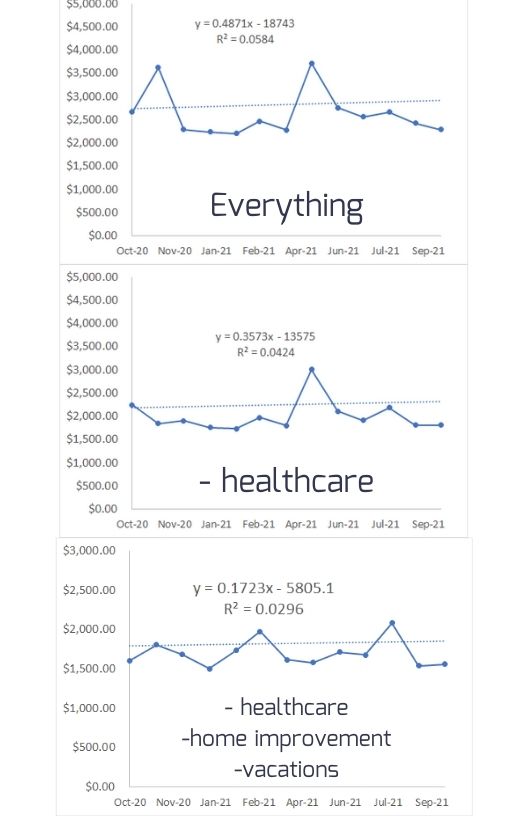
- Fitting the past 12 months of data with a linear regression & checking the correlation coefficient to see if it’s going up and if so how much and how confident we are in it.
- Doing a t-test between my monthly spending from Oct19-Oct20 and Oct20-Oct21.
That’s right, a t-test. My blog heroes Bitches Get Riches called one of my other posts the most pedantic thing on the internet, so I gotta keep that up.
The results- does inflation matter if you’re frugal (t-tests)?
Let’s start with the t-test analysis. For the broadest way to look at my spending:
- 11/2019-10/2020 Average Monthly Spending $2909
- 11/2020-10/2021 Average Spending $2628
- p value: 0.08 (not significant)
When looking at my total spending, I spent less per month in the last 12 months than I did the preceding 12 months. If inflation were affecting my spending, we’d expect it to be higher.
Inflation without healthcare spending
- 11/2019-10/2020 Average Monthly Spending $2472
- 11/2020-10/2021 Average Spending $1988
- p value: 0.003 (TOTALLY significant)
So if we ignore healthcare spending, we spent a lot less in 2021 than we did in 2020. Really no signs of inflation using this metric.
Inflation without healthcare, home improvement, and vacation spending
- 11/2019-10/2020 Average Monthly Spending $1927
- 11/2020-10/2021 Average Spending $1706
- p value: 0.048 (Significant)
Finally, even when we remove all of the volatile stuff, we spent less in 2021 than we did in 2020. And it was statistically significant. (Although just barely).
The t-tests are telling me that inflation has not affected our family and the things we spend money on.
The results- does inflation matter if you’re frugal (graphical analysis)?
The linear regressions all showed a positive slope. However, the correlation coefficient is essentially zero.

If inflation is affection our spending, it is definitely getting lost in the noise.
What does this mean? Should you FREAK OUT about inflation?
So, after writing 1500 words about my family’s spending, it’s time to answer the real question: should *you* worry about inflation.
And if you’ve read any one of my other blog posts, you know I’m going to say I can’t answer that question for you. You are the one who is living your life and only you know how you plan to earn and spend money.
The case for not freaking out
Right now, I’m not freaking out about inflation. I have years of granular data of our spending. I feel comfortable that the way the government tracks inflation doesn’t really correlate with how I spend my money.
But I have lots of other reasons not to freak out:
- My wife and I are still working. We receive cost of living adjustments in our jobs. And we spend way less than 50% of what we earn. Whatever happens we will be fine.
- I analyze data for a living. Between Big Ern and Michael Kitces and cFIREsim calculations, I have a huge amount of data on safe withdrawal rates. These data sets include periods of massive inflation and stagflation. Just because we haven’t seen inflation in 30 years does not mean that data that uses more than 100 years of returns are not valid.
- Our data is telling me that our family’s inflation rate is not tied to the government’s measures of inflation.
The case for freaking out
I’m not going to say that nobody needs to worry about inflation. If you’re living paycheck to paycheck then any increase in the cost of things is a big deal.
Inflation can also harm the elderly and disabled whose incomes are constrained by social security benefits. And SNAP benefits may not match inflation.
Finally, I can’t speak for early retirees. While I’m on the path towards early retirement, withdrawal rates are a hypothetical exercise for me. Perhaps I’d worry more if I were actually retired. I don’t know.
What you can do about it
If inflation IS bothering you, the first thing to ask yourself is “Am I tracking my expenses?”.
If you are, then pull up your data and see how much you’re spending now compared to last year. Hopefully, that will give you the data you need to feel comfortable that your spending is on track.
And if you’re not tracking your expenses, perhaps you should consider starting to do so. (I use CountAbout, *cough* affiliate link, *cough*) There are many great reasons to do so, but none of them are as important as putting your mind at ease on what your expenses will be like if you lost your job or how inflation is affecting your ability to buy food.


