Do you hate budgeting?
Have you tried to build a budget for your own family of 5 but failed every time?
Don’t worry! That’s perfectly normal. My wife and I have never liked formal “budgeting” either. But we developed our own system to manage money and build wealth.
In this post I’ll show you our secret system of how we “budget” for our family of 5. You can steal our non-budget process to help your own family build wealth.
The best part? I’m completely transparent about our process and you can see what we spent in every important category
Table of Contents
- Accidental zero based budgeting: how we manage our finances
- Our yearly budget for our family of 5
- 5 budget categories our family spends less than $2,000 per year on
- How the Pandemic Affected Our family of 5’s budget
- Summary- our family of 5 doesn’t budget
Note- this post may contain affiliate links. If you click on an affiliate link I get a small percentage of the sale at no additional cost to you.
Accidental zero based budgeting: how we manage our finances
What is zero-based budgeting?
Zero based budgeting is just a fancy name for accounting for everything you spend. The idea is that at the end of the month your income minus your expenses is equal to zero.
But wait? How can you save money or pay off debt if you have zero difference between your “income” and “expenses”.
With zero-based budgeting you remove those items from your “income” first and then budget with the rest.
Zero based budgeting sounds fancy. But it’s not a lot different from “paying yourself first”. Or the “cash envelope system” developed by Dave Ramsey.
Our “accidental” zero based budget for our family of 5
When we first got married we really were in a zero-based budgeting system. I was in college and my wife had just started her first job. It was hand-to-mouth for the first few months.
However, every time we got a raise, we put that raise towards something intentional. At first we directed a lot of the increased income towards retirement savings.
But we also made sure to set aside money for other big spending categories that we knew we would have to tackle. We created savings accounts with names like “car fund”, “home improvement fund”, “vet/pet fund”, and the “vacation fund”. Everything else flowed into our checking account where we paid our bills.
Even though we never consciously budgeted things, the money going into joint checking was roughly equal to our monthly bills.
To illustrate this, I made a graph of our minimum checking account balance each month for several years.
While we spent more in some months than others, on average our minimum balance was around $1,000. Our checking balance remained the same, even though a lot of money sloshed into, around, and out of joint checking.
Now we track all of our expenses
When we realized that we could pursue early retirement, we took our family of 5’s budget a lot more seriously. Like many other financial independence bloggers, we tracked every penny. We currently use CountAbout to track all of our expenses.
Once we started tracking our expenses we were able to find unnecessary expenses. We then cut these out of our budget for our family of 5 and redirected that money towards savings.
Now we review our expenses every month (and publish them on the blog).
For our family of 5, tracking our monthly expenses works so much better than a budget. When I hear the word budget, I think of restriction. I don’t understand how people who do zero based budgeting deal with healthcare.
Maybe one month your daughter has an ear infection and you have to pay to go to the clinic and get medicine. Then the next 3 months you don’t have any healthcare spending. How could you possibly create a monthly zero-based budget around something like that?
Instead, our family of 5 can accomplish the same goals as a budget without a budget by tracking our expenses.
Our yearly budget for our family of 5
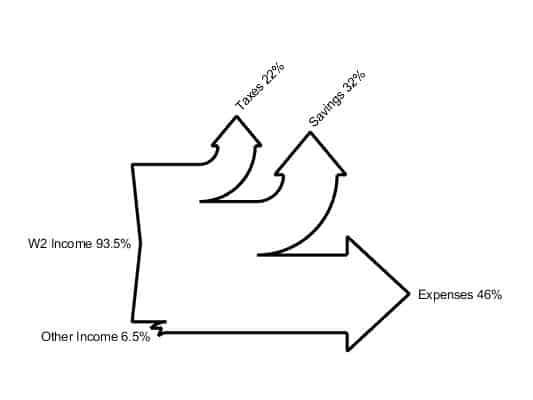
To illustrate our budget (or more accurately, an “anti-budget”) for our family of 5, I’m using Sankey diagrams. I’ll show you how every dollar flows into and out of our lives.
How our family of 5 budget is split between taxes, savings, and spending
Income
Mrs. Gov and I both work normal, W2 jobs. Our jobs account for most of our income. The non-W2 income on the graph comes from our tax return, money from informal side hustles, selling items we no longer need, and gifts.
Yes. I know. Our tax return is not “income”. However, we treat it as such. My blog, my rules.
I was surprised at how large our amount of non-W2 income turned out to be for 2019. Since it comes in throughout the year in drips and spurts it never seems like a lot.
However, over the entire year it ended up being equal to 6.5% of our gross paychecks, which is a sizable number. We save 100% of our non-W2 income, so this money really fuels our savings!
Taxes
This category includes everything that the government takes out of our paychecks on a biweekly basis including Medicare and social security.
I did not include our property taxes. We escrow our property taxes with our mortgage so I put it in the “expenses” category.
When I saw that 22% of our income went to taxes it seemed like a lot. It’s no wonder that the government breaks our taxes into a lot of subcategories on our pay stubs– it makes our taxes look a lot smaller.
Savings and Expenses
We saved 32% of our income and spent 56%. If you follow our monthly spending reports, you’d know that I claim we save closer to 50% of our paychecks (after taxes are taken out).
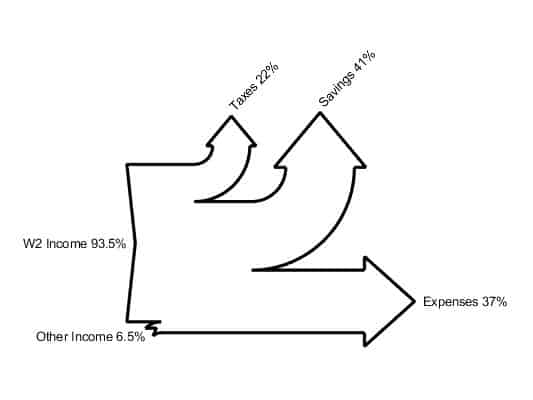
That’s because I include our mortgage principal reduction in our monthly savings rate. If you remove the principal payment from our mortgage from our expenses category you end up with the diagram below.
(We pay a lot of principal each month because we have a 10 year fixed mortgage) You can see there that of our income left over after taxes we save 41% and spend 37% (for a savings rate of 53%).
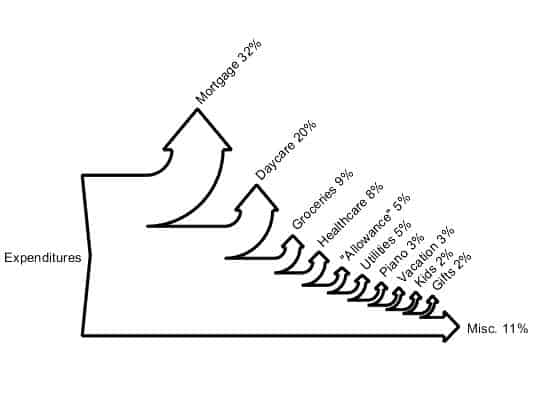
Expense budget for our family of 5
- Our mortgage (principal, interest, insurance, and property taxes) is our biggest expense. We pay a lot every month to live in an extremely bikeable neighborhood. On the other hand, our mortgage is less than what it would cost to rent an equivalent house in our neighborhood and it will be paid off by 2024 if not before.
- Daycare is our second biggest expense. I estimated the that Daycare will set back our retirement savings by about $2 million.
- Groceries comes in 3rd. However, we rock the grocery budget and spend well under the USDA thrifty plan for our family of five.
- My wife and I both get an “allowance”. While most of our money goes into joint checking, we both get a money deposited into a secret account that the other person can’t see. This works out really well for us. We don’t fight about whether someone is buying lunch at restaurants or fancy coffee. It’s a relatively large percentage of our spending (5%) but totally worth it to not fight about money!
- “Kids” only accounts for 2% of our spending. Obviously kids show up other places too (like owning a bigger house, buying more groceries, and paying for daycare). However, the kids themselves don’t actually cost that much. I thought Krisy Shen did a great recap about whether kids were expensive or not in her recent book (affiliate link). They can be more expensive than advertised in some respects, but in many ways are way cheaper than mainstream media suggests they are.
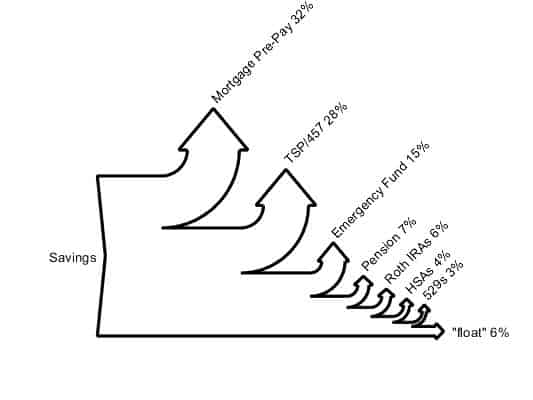
Savings budget for our family of 5
Mortgage prepayment
Get ready to throw your stones and bring your pitchforks. What kind of a personal finance blogger puts 32% of his savings into paying off his house?
Yup. This guy.
Yes. I know we should max out our tax advantaged accounts first. But– it’s super motivating to watch our mortgage shrink to zero.
Furthermore, paying off the mortgage will give us financial freedom to live on a very small fraction of our income if one of us were to lose our jobs before we reach financial independence.
Not only could we live on one income after our mortgage is cleared, it also opens the door for many partial early retirement options. For example, I’ve considered taking a deferred retirement to work on passion projects while Mrs. Gov retains her traditional job and health insurance.
Other savings
We are also putting a healthy amount into tax deferred retirement accounts, a little bit into Roths and some into our HSAs. I know we haven’t fully optimized our tax minimization.
However, I feel like we’re doing a lot of things right by saving a giant chunk of our income and I don’t have the mental bandwidth to optimize this further.
Mrs. GovWorker and I also have to contribute a fair chunk of change towards our pensions. While we don’t include this money in our financial independence calculations, there is a high likelihood that we will both receive a pension around age 60±3.
The last thing to note is that we are putting a small amount into 529 plans for our daughters. We have a lot of conflicted feelings about that. But at this point, we feel like putting a small amount away for their college is the best of both worlds for us at this stage.
Note- Sankey diagrams inspired by code I found on the MATLB(TM) file exchange. Citation: James Spelling (2020). drawSankey (https://www.mathworks.com/matlabcentral/fileexchange/26573-drawsankey), MATLAB Central File Exchange. Retrieved January 18, 2020.
5 budget categories our family spends less than $2,000 per year on
Want to know what was in that “miscellaneous” spending category? Here is what our family spent in 5 minor budget categories.
Gas/Auto- $1,554.18
Our biggest expense as a family of five that was less than $2,000 in 2019 was gas and auto. We spent about $1,500 on our car last year. Our biggest car expense was car insurance which was about $600 for full coverage on our 2015 Mazda5.
The rest of the money was spent on gasoline. We bike most of the places we need to go. (Check out my love letter to our cargo bicycle). My wife and I both live within 2 miles of our offices. While this means that our housing costs are high, our transportation costs are low. And our commuting time consists of communing with nature. I love our house.
Home Improvements- $1,246.03
Since pursuing financial independence, this is the budget category that has shrunk the most for our family of 5!
We bought a distressed college rental and have been fixing it up for the past 9 years. For a long time, when we got a lump sum of money, (or a raise) we’d throw that extra money at the house.
Over the years we’ve added central air, put drain tile in the basement so it didn’t flood every rainstorm, and DIY’ed a kitchen and bathroom remodel.
This past year, we only put $1,200 into the house.
At some point, I’m sure this category will balloon up again when we need a new roof or finally address some insulation issues. But each year we can keep this low is another year we can save more towards FI.
Bicycles $1,065.75
This might be one of our budget categories less than $2,000 where we spent more than an average family of 5.
So you know what happens when you don’t spend a lot of money on cars? You end up spending a lot of money on bicycle maintenance
My wife and I have six bicycles between the two of us:
- A tandem bicycle
- The cargo bicycle
- My summer bicycle
- My winter bicycle
- Mrs. Gov’s summer bicycle
- Mrs. Gov’s winter bicycle
We have winter bicycles that we specifically let get trashed by the road salt and slush in the winter to keep our “summer bikes” running more smoothly.
Even with the summer bike/winter bike lineup, those bikes need to get tuned up. And so do the kids bikes!
I like to take our bicycles to a vocational training program for at-risk youth to get fixed. There bicycle maintenance costs about half as much as a normal store, and it helps the community. Unfortunately they won’t touch our cargo bike ($450 tune-up :-/).
Yes, in theory, bicycle maintenance is something I could do myself. But I hate doing it. I get super frustrated adjusting the brakes and the derailleurs. They are always too loose or too tight. I’d much rather pay someone who can “feel” how it should be. That frees up time for me to work my real job, parent, and write this blog.
Date & Babysitting $794.40
We have 3 kids and love them very much. But even though they are amazing humans, we need breaks to focus on our relationships. Mrs. Gov and I have been married for 16 years and we’ve had kids for 13/18ths of the time we’ve known each other. It’s important to find time to connect.
That being said, we stopped going on “dates”.
Dates seemed like a disappointment. We’d go to a restaurant and pay too much for sub-optimal food, then try to figure out how to kill another 1-2 hours before the kids were in bed.
And sometimes we’d come home and have to put the kids in bed anyway. If we still had to deal with the most taxing parenting tasks, was it really worth dropping $50-$90? It seemed like we were spending money and not getting any extra joy out of the date.
We’ve now switched it up and have “at home dates” after the kids go to bed. We still find time to make special couple time. But we don’t have to talk over noisy restaurant patrons or worry about paying a babysitter.
Restaurants $585.80
We spent less than $600 on restaurants last year for our family of 5. I feel this is a budget category where our family of 5 really shines!
I saw someone on Twitter saying that they were having problems sticking to their $100 per month budget for 1 person! We spent just over $100 per person per year in this category.
To be fair- this doesn’t include restaurant food purchased on vacation. (That’s in the vacation category). Nor does it include restaurant food purchased on dates (that’s in dates).
We rarely eat at restaurants- even on vacation. I have food allergies, which limits the number of restaurants we can eat at.
And even though there are plenty of restaurants that have gluten-free food, I find that restaurants are always a let-down. I feel like crap after eating at a restaurant. I’d much rather just stop at a grocery store and eat fruits and vegetables if I need to consume calories on the go.
Likewise the “treat” of not-cooking is by far out-weighed by the “chore” of dealing with 3 feral kids at a table in public. Mealtimes are a chaotic battle-field at home. Why expose the general public to our shenanigans?
How the Pandemic Affected Our family of 5’s budget
The previous analysis was from 2019 when our spending was “normal”. But of course in March 2020, our world was turned upside down with the coronavirus.
In the beginning, I did a lot of shopping to find time to occupy the kids while trying to work at home. I’d say things like
“I bought you this sand art kit!”
“Look, today you can use this scratchy paper, but leave me alone!!”
At the same time the Amazon delivery driver became familiar with every inch of my doorstep, we had other expenses drop precipitously. We stopped sending our youngest to daycare. As I’ve written before, daycare is one of our largest expenses.
Since I wanted to be transparent about our family of 5’s budget, I thought I’d share how the pandemic affected our spending.
Relative spending
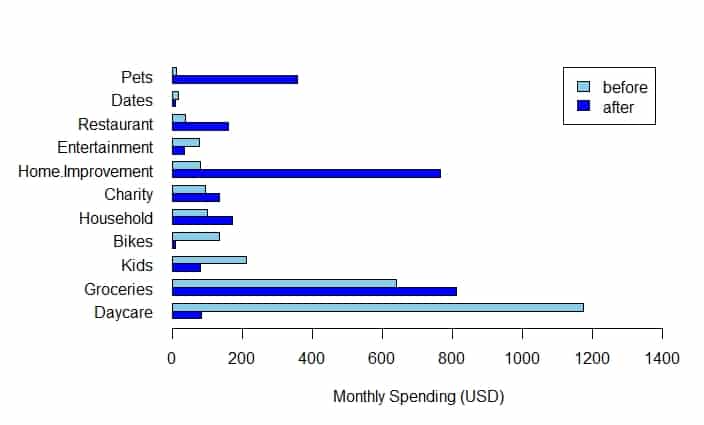
As a scientist, I always need to visualize my data to get a feel of what is going on. I made these graphs to help me see how the pandemic affected our spending.

I averaged our spending over the 4 months before the pandemic to get the “before” numbers. Likewise, I averaged over a 4 month window (April-July) to get my after numbers. The data show that we spent less on bikes, dates, entertainment, and daycare after the pandemic started. No big surprise, right?
On the other hand, we increased our spending on groceries, charity, and household. (Also not surprising).
Did I mention we spent more than 100% more in some categories?? We spent a lot more on pets, home improvements, and restaurants.
Normally we never eat at restaurants. But to me it seemed like our civic duty to get take-out as the demand for restaurants evaporated overnight. I’d much rather have the restaurants open and employing their workers than to brag about how little we spend on restaurants to readers of my finance blog.
Absolute spending
Any scientist worth his/her salt would tell you that the graph I made for you is slightly misleading. I already said restaurants were a tiny fraction of our spending. Therefore, it’s not really important that we doubled (or more) our spending on restaurants.
In absolute terms, our restaurant spending was still a tiny fraction of our total spending. However, daycare and groceries ate up a lot of our budget before the pandemic, so even small percentage changes affected our spending quite a bit.
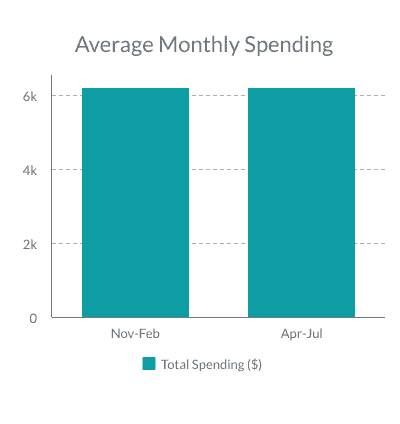
The pandemic didn’t affect our total spending
Surprisingly, our total spending was not affected by the pandemic. How can that be when we didn’t have daycare costs?
It’s simple. We knew we were facing a once-in-a-lifetime challenge. We had saved money for rainy days. In fact, our rainy-day-fund has many years worth of hurricanes saved up.
I have no interest in eeking out a couple of extra thousand dollars in savings while our whole lives are disrupted and we have the means to make our lives better.
If ever there was a time, coronavirus is the time to “smoke em if you’ve got em”.
Money is for more than making your Personal Capital dashboard go up.
So how did we smoke em’ you might ask? Well, first of all, Mrs. Gov finally thought we had enough time for a dog. I’ve wanted a greyhound for the longest time. (The longest time). Kenny was worth the wait! He’s made my life better in countless ways. Even our greyhound cost us $1,900 in 2020.
The other major category that saw a dramatic increase in spending was “home improvement”. It all started when 2 of my daughters started punching and pulling each other’s hair because they wanted to use the bathroom at the same time.
We *have* two bathrooms in the house but one was kind of gross in the unfinished basement and no one wanted to use it.
So I gutted that bathroom and redid it at the start of the pandemic. I also bought some inexpensive epoxy paint and LED lights. This turned our unfinished basement from a dark, dirty dungeon into a passable work at home space (before/after pictures above).
Honestly, on a per-dollar basement, the lights probably had some of the best enjoyment ROI of anything I’ve done in a long time.

So we could have scrimped and saved and suffered our way through the pandemic. But we decided to invest in our happiness instead.
Summary- our family of 5 doesn’t budget
While our family of 5 doesn’t have a traditional budget, we track every single expense. And we’ve developed our own techniques for making sure we’re meeting our savings goals. This works really well for us.
Interested in tracking spending CountAbout like us- click here for a 15 day free trial!
Disagree with my take on budgeting? Share this article on social media and tag me! I’d love to hear from you.
Get Gov Worker’s top 4 tips for federal employees!
